Passo Duran
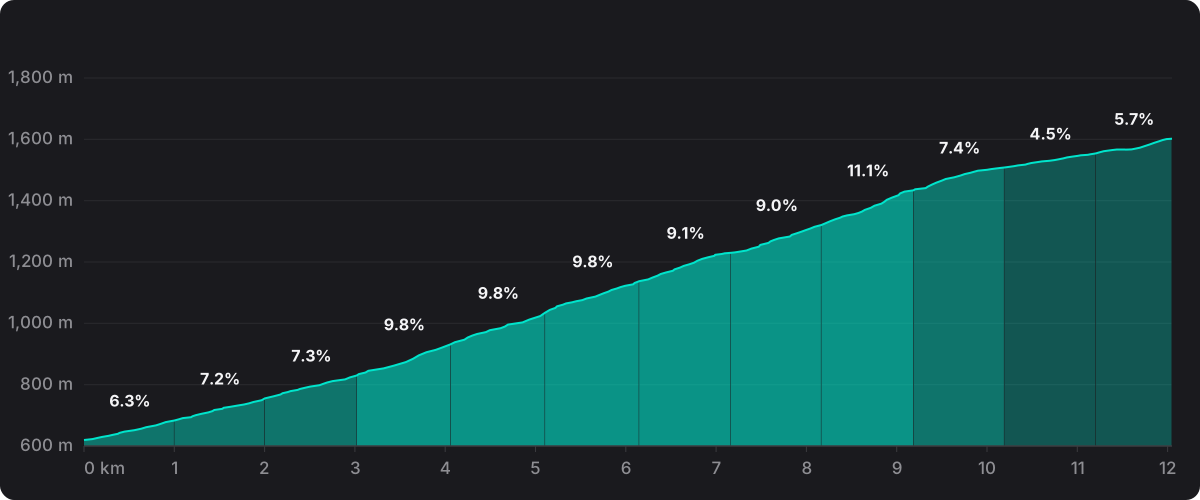
12.1 km at 8.2%, summit at 1,601 m. Cat 1.
- Length
- 12.1 km
- Average gradient
- 8.2%
- Height gained
- 992 m
- Summit
- 1,601 m
- Steepest km
- 11.5% measured on the route
- Category
- Cat 1
The climb
Passo Duran climbs 12.1 km at an average of 8.2%, gaining 992 m to a summit at 1,601 m. It is neither relentless nor erratic: the kilometres move either side of the average by a point or two.
The hardest kilometre measures 11.1% and comes in the final third of the climb, and 6 kilometres of the ascent average more than 8%, one of them above 10%. The final kilometre eases to 5.7%, which is where the climb gives something back.
In ProPace's stage data it appears on the single stage listed below.
Stages that climbed it
| Stage | Date | Summit at | Category |
|---|---|---|---|
| Giro d'Italia 2026, stage 19: Feltre → Piani di Pezzè | 29 May 2026 | km 59.6 | Cat 1 |
Stages since 2024 whose route climbed to this summit, matched on ProPace's route data. Category as listed for that stage where the roadbook data is in the app.
In ProPace you ride the whole stage, this climb included, against a pro reference in the real wind from the day. How the simulation works is set out in How much slower than a pro are you?
Ride the stages over Passo Duran against a pro in ProPace. Free on iOS.
